Decoding Complexity
With Visual Analytics
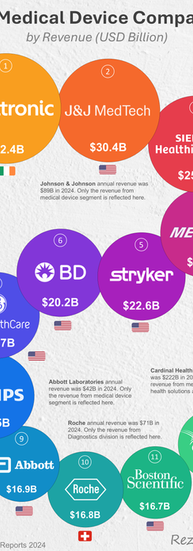
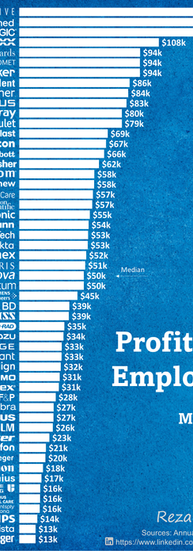
Business stories are typically told using financial data. However, financial data can be daunting if you are not familiar with it, and as a result, the story often gets lost. This is where I come in. I transform complex industry-specific financial data into clear, compelling visuals that reveal patterns, trends, and insights concisely. My goal is to bridge the gap between raw financial numbers and a real-world understanding of industries through storytelling and visual analytics, enabling executives, strategists, investors, employees, and even curious individuals to gain a deeper understanding of various industries, key players, their evolution, and their dynamics.


About Me

Hi! My name is Reza Zahiri and I have over 15 years of industrial and leadership experience in technology and product development across startups, mid-size companies, and global organizations, with a focus on medical and industrial imaging, computer vision, AI, and visual analytics.
I hold a PhD in Computer Engineering from the University of British Columbia (UBC), where I am still an Adjunct Prof and an Executive MBA from Simon Fraser University (SFU).
On social media, I typically write about the industries I have worked in, share insights, discuss topics that interest me, and provide general business commentary. Occasionally, I put a company under a microscope and offer data-driven critical analysis while trying to be constructive.
Some of my posts have received millions of views on social media. Last year my content have received over 50 million views. I have also been recognized as top 10 Canadian content creators.
This website is mainly aimed at showcasing some of my work. I plan to publish industry-specific books that incorporate my analytics and infographics in the coming years. In the meantime, feel free to follow me on social media, where I will continue to publish.


